These are the most stable tech sectors for job seekers in 2024

Home » Archive by Category "Technology" (Page 206)

By Amanda Kavanagh

Instability is at the heart of technology, as new innovations constantly change the game. However, the last couple of years have been especially volatile as interest rates rose, VC funding free-for-alls dried up, and mass layoffs began.  Now things are beginning to stabilise, and organisations are hiring more strategically, jobs across tech sectors are a safer bet. Here’s where savvy job seekers are looking in 2024. AI The chaotic CEO changes at ChatGPT creator Open AI late last year don’t exactly scream stability, but there is no denying that AI and Generative AI remain the hottest topics in town. While…

This story continues at The Next Web

Source:: The Next Web

How to think about Apple and spatial computing

Home » Archive by Category "Technology" (Page 206)

It might not yet be clear where Apple’s visionOS (and Vision Pro headset) aims to go. But for enterprise technology decision makers, one way to understand it all is to study what the company itself says. First, where isn’t it going?

According to Apple, it isn’t trying to invent products for use in virtual, augmented, mixed, or even extended reality (VR, AR, XR, or MR). Sure, Vision Pro could support such experiences, but those need to be seen as adjunctive to a bigger ambition.

To read this article in full, please click here

Source:: Computer World

Laptop Statistics 2024 – By Segmentation, Companies, Shipments, Operating System, Market Size and Website Traffic

Home » Archive by Category "Technology" (Page 206)

By Barry Elad

The Growth of the Global Market of Laptops

Introduction

Laptop Market Overview: The global laptop market is projected to generate $257.4 billion by the end of 2031, growing at a rate of 4.4% annually from 2022. This growth is driven by increasing demand in educational and corporate settings. Factors influencing this growth include technological progress, economic factors, consumer preferences, and business requirements. These statistics highlight the growing importance of laptops in various sectors.

Editor’s Choice

  • Statista reports that in 2023, the global laptop market’s revenue is expected to be around USD 127.6 billion, a 1.4% increase from 2022.
  • Revenue per person in the laptop market is estimated to be USD 16.61 in 2023.
  • In 2023, the total number of laptops sold worldwide is expected to reach 188.1 million, a 3% increase from the previous year.
  • China leads in laptop market revenue with USD 23.2 billion, anticipating a 3.28% growth annually from 2023 to 2028.
  • By the end of 2024, the laptop market is expected to see a 1.0% increase in the number of units sold.
  • In 2023, 23.7% of consumers are expected to own gaming hardware.
  • As of June 2023, Apple, Lenovo, and HP are the top laptop manufacturers, with market shares of 17%, 15%, and 12%, respectively.
  • Post-pandemic, the global laptop market has seen a 10% increase in revenue over two years.
  • Earthweb reports that 67% of the global population, approximately 5 billion people, used laptops in the first quarter of 2022.

(Source: technavio.com)

  • As of reports, the North American region is dominating the global market of laptops with 42% CAGR from 2023 to 2028 which is followed by the European region.

Facts of Laptops

  • The global gaming laptop market is expected to produce about 26.93 million units and gain USD 26.85 billion in revenue in 2023.
  • In 2023, Lenovo, Dell, and HP, the most popular laptop brands, are dominating the market with a combined share of 60%.
  • The laptop industry is forecasted to grow at an CAGR of 4% until 2027.
  • By 2025, the demand for laptops is projected to surge, accounting for a 56.3% market share, which will help stabilize the industry.
  • In 2023, it’s estimated that there will be 272.4 million laptops in circulation.
  • As of 2023, around 80% of laptop users have installed antivirus software on their devices.
  • The United States is currently the largest exporter of laptops globally.
  • In 2023, according to an analysis by Fortunly, Lenovo, HP Inc., and Dell lead in laptop shipments, with a combined market share of 6.95%.
  • Additionally, in the first half of 2023, global laptop sales reached USD 127.6 billion, with 114.8 million units shipped.

Global Statistics of Laptops

By Revenue

laptops-worldwide-revenue

(Reference: statista.com)

  • In 2023, the global laptop market is projected to earn $127.6 billion, marking a 1.4% increase from the previous year.
  • Looking ahead, the revenue trends for the laptop market are as follows:
    • 2024: Expected revenue is $127.5 billion, a slight decrease of 0.1%.
    • 2025: Anticipated revenue is $132.1 billion, showing a 3.6% increase.
    • 2026: Forecasted revenue is $136.7 billion, with a growth of 3.5%.
    • 2027: Projected revenue is $142 billion, increasing by 3.9%.
    • 2028: Expected revenue is $147.4 billion, a 3.8% rise.

By Average Revenue Per Capita

laptops-worldwide-average-revenue-per-capita

(Reference: statista.com)

  • In 2023, the average revenue generated per person in the global laptop market is approximately $16.61.
  • The projected average revenue per person in the coming years is as follows:
    • 2024: Expected to be $16.45.
    • 2025: Anticipated to increase to $16.91.
    • 2026: Forecasted to grow to $17.35.
    • 2027: Projected to rise to $17.89.
    • 2028: Expected to reach $18.43.

Revenue Comparison by Country

laptops-worldwide-revenue-comparison

(Reference: statista.com)

  • China is leading in laptop market revenue in 2023, expected to earn $23.25 billion, a 0.8% increase from the previous year. The market is forecasted to grow at an annual rate of 3.28% from 2023 to 2028.
  • The United States follows with a projected revenue of $21.2 billion in 2023 and an anticipated annual growth rate of 1.45% from 2023 to 2028.
  • Japan’s laptop market is expected to generate $7.8 billion in 2023, but it is projected to see a decrease in growth at a rate of -1.88% annually from 2023 to 2028.
  • India’s market is forecasted to reach $6.0 billion in 2023, with a robust annual growth rate of 7% from 2023 to 2028.
  • Turkey is projected to earn $3.8 billion in 2023, with an expected annual growth rate of 4.40% from 2023 to 2028.

By Volume and Volume Growth

the-worldwide-volume-earned-by-the-laptops-market-in-2023

(Reference: statista.com)

  • In 2023, the global laptop market is expected to sell 188.1 million units, representing a 3% increase from the previous year.
  • The projected sales volumes for laptops in the coming years are as follows:
    • 2024: Expected to reach 189.9 million units, a growth of 1%.
    • 2025: Anticipated to be 193.6 million units, increasing by 1.9%.
    • 2026: Forecasted to be 197.3 million units, also growing by 1.9%.
    • 2027: Projected to reach 202.4 million units, with a 2.6% increase.
    • 2028: Expected to hit 207.1 million units, a rise of 2.3%.

By Price Per Unit

the-global-market-of-laptops-price-per-unit

(Reference: statista.com)

  • In 2023, the average price for a laptop in the global market is expected to be around $640 (noted as $0.64K).
  • The expected average prices per laptop unit in the following years are:
    • 2024: Estimated to be $630 ($0.63K).
    • 2025: Projected to be around $640 again ($0.64K).
    • 2026: Anticipated to increase slightly to $650 ($0.65K).
    • 2027: Forecasted to rise to $660 ($0.66K).
    • 2028: Expected to reach $680 ($0.68K).

By Gaming Share

laptops-worldwide-gaming-hardware-penetration-rate.

(Reference: statista.com)

  • In 2023, approximately 23.7% of the global market is using gaming hardware.
  • The expected market penetration rates for gaming hardware over the next five years are as follows:
    • 2024: Projected to increase to 24.8%.
    • 2025: Anticipated to rise to 25.6%.
    • 2026: Expected to grow further to 26.4%.
    • 2027: Forecasted to reach 27%.
    • 2028: Estimated to climb to 27.6%.

By Brand Share

-the-top-manufacturers-of-the-laptops-market-around-the-world.

(Reference: statista.com)

  • According to Statista’s recent analysis in June 2023, the leading laptop manufacturers globally are Apple with a 17% market share, Lenovo at 15%, and HP holding 12%.
  • The market shares for other significant laptop manufacturers are as follows:
    • Acer holds 11% of the market.
    • Asus has a 9% share.
    • Dell possesses 7%.
    • Microsoft accounts for 4%.
    • Huawei has 3% of the market.
    • Razer and Samsung each have a 2% share.
    • Other manufacturers collectively make up 18% of the market.

Laptop Statistics by Segmentation

  • According to the reports of Einpresswire, the 2-in-1 laptop segment is going to account for the fastest growth rate of 6% CAGR from 2022 to 2031.
  • On the other hand, based on design the largest share is going to account for the notebook segment with 5.2% of CAGR by the end of 2031.
  • According to the reports of Grand View Research analysis, based on type the largest share was accounted by the traditional laptop segment with 56% by the end of 2022.
  • Based on screen size, the largest market share was accounted by the 15.” to 16.9” segment accounts for 48%, and the 11” to 12.9” segment is expected to reach a CAGR of 8.4% from 2023 to 2031.
  • Based on price, the $1001 to $1500 segment is going to hold the highest market share at a CAGR of 7.1% from 2023 to 2031.
  • Lastly, in 2022 based on end-use the business segment holds the largest share of 48%, and is expected that the segment is going to be dominating by 2030.

Laptop Statistics by Companies

  • Whereas, in 2023 the global market share of laptop companies such as Toshiba, MSI, Microsoft, and Samsung accounted for 13.9%.
  • By the end of 2028, the global laptop sales rate is expected to grow at a CAGR of 2.93%.
  • In the 3rd quarter of 2023, the estimated laptop sales share of the market accounts for 24% share.
  • Lenovo has an estimated 24% laptop sales share over the global marketplace in the 3rd quarter of 2023.
  • As of 2023, HP’s popular models such as Envy, Elitebook, Pavilion, Omen, and Pavilion gaming accounted for a market share of 22.5% in 2023.
  • By the 3rd quarter of 2023, the global share of Dell Technologies laptops holds 17.4% and by the end of 2023, it is expected to reach 26.7%.
  • Furthermore, other company’s market shares are followed by Apple (13.3%), Acer (5.9%), ASUS (2.9%), and others (7.7%).

Laptop Statistics by Shipments

  • According to Fortunly’s article analysis in 2023, the top three vendors of laptops such as Lenovo, HP Inc., and Dell accounted for 6.95% of unit shipments.
  • On the other side, global laptop sales totaled $127.6 billion, and 114.8 million units shipped by the 2nd quarter of 2023.
  • In the United States 2nd quarter of 2023, the laptop shipment market statistics by brands are followed by Dell (4.85 million), HP Inc. (4.84 million), Lenovo (3 million), Apple (2.4 million), Acer (1.07 million), ASUS (523 thousand), and others (1.4 million).

Laptop statistics by Operating System

operating-system-market-share-worldwide

(Reference: statcounter.com)

United States (as of November 2023):

  • Windows leads with 37.22% of the laptop market.
  • OS X holds 22.49%.
  • iOS has a share of 18.15%.
  • Android is at 12.89%.
  • Chrome OS accounts for 5.31%.
  • Linux holds 1.64%.

Global Market (as of November 2023):

  • Android is the most popular with 38.27%.
  • Windows has 30.6%.
  • iOS comes in with 16.54%.
  • OS X holds 9.4%.
  • Chrome OS is at 1.66%.
  • Linux has 1.44%.

First Quarter of 2023:

  • Android dominates with 41.48%.
  • Windows follows with 28.32%.
  • iOS has 17.31%.
  • OS X is at 7.02%.
  • Chrome OS accounts for 1.32%.
  • Others make up 3.07%.

Second Quarter of 2023:

  • Android leads with 39.16%.
  • Windows has 30.15%.
  • iOS is at 16.47%.
  • OS X holds 8.78%.
  • Chrome OS is at 1.45%.
  • Others account for 1.84%.

Laptops Market Size by Country

-laptop-market-size-by-country.

(Reference: indexbox.io)

  • As of the above pie chart analysis, the highest market size of the laptop industry in 2023 is going to be accounted for by the United States with a 26.1% share.
  • The 2nd and 3rd highest market share is going to constitute China (17.8%), and Japan (6.1%) respectively.
  • Whereas, Brazil and Poland hold a market share of 4.8% and 4.6% respectively.
  • Rest other countries together make a share of 45.1%.

Indian Laptops Statistics

  • According to the reports of Statista in 2023, almost 76.2% of survey respondents stated that they have one laptop in their house.
  • Whereas, 15.8% of people stated that they have two laptops in their home.
  • India’s laptop market is dominated by HP and Dell with a market share of 55% of which 23.1% of respondents claimed to have Dell Technologies.

Laptop Statistics by Website Traffic

By Country

 laptopmag.com-Web-Traffic-by-Country

(Source: similarweb.com)

  • As of November 2023, the United States had 26.12% of total traffic on laptopmag.com, but it recorded an increase in total website visitors by 13.68%.
  • Other countries that recorded total website traffic are followed by the United Kingdom = 7.84% (-4.53%), Canada = 5.89% (+5.67%), India = 4.39% (+2.13%), and Australia = 3.91% (+12.4%)
  • Whereas, other countries collectively made 38.83% of website traffic.

By Age Group

-laptopmag-com-website-traffic-demographics.

(Reference: similarweb.com)

  • As of the above graph analysis, the Laptop Statistics by the demographic state that, the highest number of users observed is between the age group of 25 to 34 years resulting in 32.65%.
  • There are 21.04% of laptop users aged between 18 to 24 years.
  • 19.23% and 13.78% belong respectively to 35 to 44 years and 45 to 54 years.
  • 8.3% of users are aged between 55 to 64 years.
  • And there are 4.99% of laptop users contributing from the age of above 65 years.

By Traffic Source

laptopmag-com-top-traffic-sources

(Reference: similarweb.com)

  • As per Laptop statistics, the highest rate of rate of traffic towards laptopmag.com is by organic search (85.03%).
  • While the direct source contributes 11.46% followed by referrals with 2.37%.
  • Furthermore, other traffic sources consist of social (0.89%), mail (0.24%), and display (<0.01%).

By Social Media Referral Rate

social-media-traffic-to-laptopmag-com

(Reference: similarweb.com)

  • Reddit has the highest rate of social media with a referral rate of 33.82%.
  • Others are followed by Facebook (27.99%), Twitter (18.65%), Linkedin (6.04%), Quora (5.89%), and others (7.61%).

Conclusion

As of today after completing the article on laptop statistics, it can be stated that the overall market is evolving rapidly or can be termed as the fastest-growing market which has made people’s lives easier. In the recent year 2023, the shipment of Lenovo laptops remained highest with a market share of 23.65%.

If you want to know more details about the global market of laptops, then this article will provide you with all basic and current statistics based on revenue, market share, shipment units, website traffic, companies, country, operating systems, etc. All these are discussed elaborately above hope, this will you understand the topic effectively.

Source:: Coolest Gadgets

How this startup uses AI to give speech-impaired people their voice back

Home » Archive by Category "Technology" (Page 206)

By Linnea Ahlgren

There is big tech — and then there is smaller tech with big impact. Dutch AI startup Whispp is using assistive voice technology to convert speech diminished by ailments such as stuttering, throat cancer, vocal cord paralysis, and ALS, into the person’s original, natural voice. The startup, based in Eindhoven, just secured a €750,000 seed funding round led by LUMO Labs to launch its assistive voice technology and its first paid and subscription-based calling app. Whispp will also use the funds raised to expand into European and US markets. Furthermore, the company is one of this year’s CES 2024 Innovation Award…

This story continues at The Next Web

Source:: The Next Web

Dutch online supermarket Picnic bags €355mn after international expansion

Home » Archive by Category "Technology" (Page 206)

By Thomas Macaulay

Dutch online supermarket Picnic has bagged a cool €355mn in funding after a year of international expansion, the company announced today. The grocery delivery service launched in the Netherlands back in 2015, before later entering France and Germany. Picnic said that the expansion across Europe helped the business grow by 40% in 2023. Turnover for the year reached an estimated €1.25bn. A particularly thriving new market is Hamburg, which hit a turnover of €40mn just six months after launching last April. That made it Picnic’s fastest-growing city. In the Netherlands, meanwhile, the recent growth has come from adding new customers in…

This story continues at The Next Web

Source:: The Next Web

Solar Charger Statistics 2024 – By Types, Shipments, Market Size and Countries

Home » Archive by Category "Technology" (Page 206)

By Barry Elad

Portable_Solar_Charger_Market_Overview

Introduction

Solar Charger Statistics: As of recent reports analysis, the global market size of the Solar Charger is expected to reach $13.1 billion by the end of 2033. The sales of solar chargers have increased due to the increasing demand for electric vehicles and the increasing use of electricity in the transportation industry. The global solar charger market is segmented based on types, applications, geography, shipment, market share, etc. These solar charger statistics include insights from various aspects that provide light on why Solar Chargers are a growing industry around the world.

Editor’s Choice

  • According to the report’s analysis of Fact.MR, the worldwide market size of the Solar Charger in 2023 is expected to be almost $3.5 billion.
  • The global market growth is predicted to reach a CAGR of 14.1% from 2023 to 2033.
  • The global market share of Mono-crystalline Panels is supposed to be 70% in 2023.
  • By the end of 2023, the largest market of solar chargers is going to be achieved by Canada in the region of North America with a share of 30%.
  • According to the reports of maximize market research, the fastest growing market share is going to be achieved by the Middle East and African region with a CAGR of 21% from 2023 to 2029.
  • According to the reports of Maximize Market Research, the market valuation of portable solar chargers in 2022 was $3.64 billion and by the end of 2029, the valuation is expected to reach $13.83 with a CAGR of 21% from 2022 to 2029.
  • In the portable solar charger market, the foldable type segment is expected to reach a CAGR of 22% by the end of 2029.
  • By the end of 2029, the use of solar chargers is expected to increase faster in the defense sector with a CAGR of 21%.
  • Around the world, most solar chargers are imported from China, Vietnam, and India.
  • As of reports, there are 2,735 global buyers available in 190 countries and 2,095 global suppliers of solar chargers are available in 61 countries in 2023.

What is a Solar Charger?

Solar chargers are generally portable and employ solar energy to supply electricity to many electronic devices and batteries. A solar charger consists of 3 important components such as a solar panel, a rechargeable battery, and a charge controller.

The solar chargers are used as travel chargers for mobile phones, cameras, laptops, gaming devices, and tablets; the solar chargers are integrated with laptop bags, solar backpacks, and rucksacks; portable solutions for homes, standalone non-portable charging stations for e-bikes, and solar power units for public spaces.

Facts of Solar Charger

  • As of reports in June 2023, a new company that finances assets of solar energy and digital devices (Yellow) in Africa has raised around $14 million in a Series B financing round for enabling growth efforts over the African region.
  • In July 2023, a Mexican solar panel start-up known as ‘Bright’ which was backed by Hollywood hotshot Leonardo DiCaprio announced that the fund has raised $31.5 million in Series C financing round.

(Source: marketresearchfuture.com)

  • According to Market Research Future, the market size of the portable solar charger by the end of 2023 is expected to be $0.24 billion and by 2023 it is supposed to be $0.9 billion with a market growth of 17.50% from 2023 to 2032.
  • In 2022, the dominating market of the portable solar charger industry was North America with a share of 45.80%, which is followed by Europe, Asia Pacific, and the rest of the world.
  • The leading manufacturers are Renogy, HQST, Goal Zero, Go Power, Acopower, Voltaic System, EMPO-NI off-grid solutions, Anker Innovations Limited, etc.

 Solar-Battery-Charger-Market-Size-And-Forecast

(Source: verifiedmarketresearch.com)

  • According to the reports of Solar battery charger market size is projected to be around $5.1 billion by the end of 2030, with a CAGR of 18.7% from 2022 to 2030.
  • There are 3 different types of solar charge controllers available Simple 1 or 2-stage controls, Pulse width modulated, and maximum power point tracking.

General Statistics

  • According to the reports of Energy ARC, the global market size of solar panels is expected to reach $1,296.3 million by the end of 2027 with a CAGR of 17.5% from 2022 to 2027.
  • As of knowledge sourcing intelligence report analysis, the portable solar charger market is growing enormously due to the surge in activities such as hiking, traveling, and camping.
  • According to SGB Media reports, in 2023 almost 97% of Americans have planned to enjoy outdoor activities.
  • According to the IBEF reports, by the end of 2028 in India the travel and tourism sector is going to contribute around $512 billion.
  • The three important products of solar chargers are portable 5V/2A 10W USB Solar chargers (designed by Flexsolar), sCharger-5 (Suntactics), and SOLAR ADVENTURE II (Powertraveller International Ltd.)
  • Portable 5V/2A 10W USB Solar chargers are used to charge mobile phones, power banks, and rechargeable USB devices under sunlight.
  • sCharger-5 supports all USB devices such as Samsung phones, the latest iPhones, and power banks in which the charger must be kept in 30 degrees of direct sunlight.
  • Solar Adventure II is capable of charging most 5V electronic devices such as smartwatches, action cameras, smartphones, etc.
  • The solar chargers can easily charge lead acid batteries and Ni-Cd batteries with capacities up to 48V and 4000 mAh.

Advantages of Solar Charger

  • It requires natural energy and no requirement of external electricity.
  • The overall operational and maintenance cost is zero.
  • Provides an immediate charging facility (anywhere and anytime) for recharging electrical items such as tablet devices, mobile phones, etc.
  • The purchasing and set up cost is expensive and mostly depends on specifications.

Solar Charger Statistics by Types (Efficiency)

  • The solar charger includes solar panels that allow for converting solar energy into electrical energy.
  • Different types of panels used are Monocrystalline solar chargers, Poly-crystalline solar chargers, Amorphous solar chargers, and Hybrid solar chargers.
  • According to the reports of Transparency Market Research 2023, the most effective chargers are Mono-crystalline with 15% efficiency; other efficiency shares of solar chargers are followed by Poly-crystalline (13%), Amorphous Amorphous (7%), and hybrid (18%)

Solar Charger Statistics by Shipments

  • According to the report’s analysis of Volza Grow Global, the total solar charger shipment units turned out 11.9K which is imported by 2,735 and 2,095 world importers and suppliers respectively.
  • The top 3 importers of solar chargers statistics by shipments are followed by Uganda (2,359), the United States (2,343), and Vietnam (1,334).
  • The top product categories of solar chargers around the world in 2023 are HSN Code 85044000000, HSN Code 85044090, and HSN Code 39269099.
  • The import market share with several shipments is followed by Cloud Network Technology Singapore PTE Ltd. (976), Funding Precision Component Co. Ltd. (406), and Star Aaroh General Investments Ltd Jinja Jinja Municipality East Jinja Central Central Jinja Eastmain Street East Jinja City Na 8081 Jinja (368).
  • The export market share statistics by shipments are followed by Funding Precision Component Co. Ltd (789), New Spread Trading Limited (546), and Cloud Network Technology Singapore PTE Ltd. (422).

Solar Battery Statistics by Market Size

  • According to the reports of Straits Research analysis, the global market size of solar batteries is expected to reach around $540 million by the end of 2030.
  • The market share is going to grow at a CAGR of 15.5% from 2022 to 2030.
  • As of 2023, the revenue share of the Asia Pacific region is around 40% and the market value is supposed to be $215 million by the end of 2030 at a CAGR of 17.5%.
  • Whereas by the end of 2030, the 2nd largest market value is going to be accounted for by the European region resulting in $175 million with a CAGR of 15.8%.
  • The 3rd largest market is going to be achieved by the North American region with around $40 million at a CAGR of 9% from 2023 to 2030.

Solar Chargers Statistics by Countries

Global Buyers and Suppliers

  • Number of buyer’s statistics by countries is followed by the United States (673), Uganda (377), India (318), Vietnam (182), Pakistan (169), Peru (97), Kenya (89), Philippines (76), Sri Lanka (56), and Indonesia (50).
  • Number of suppliers are followed by countries are followed by China (1180), India (185), the United States (131), Hong Kong (116), and Vietnam (56).

Global Importers and Suppliers

  • Global import of solar chargers by countries are followed by Uganda (2359), United States (2343), Vietnam (1334), India (1150), Kenya (670), Peru (480), Pakistan (451), Tanzania (431), Spain (220), Turkey (217), Singapore (204), Indonesia (136), Netherlands (122), Philippines (115), Australia (111), Sri Lanka (109), and Nigeria (105).
  • Global export of solar chargers by countries is followed by China (7299), Vietnam (1695), India (1076), Hong Kong (307), United States (294), Switzerland (165), Netherlands (145), and Taiwan (113).

Solar Chargers Statistics by Rank

#1. Blavor solar power bank (overall best)

(Source: zdnet.com)

  • This solar charger includes features such as 20,000 mAh with 3 different light modes and, the capability of fast charging by using a maximum of 18W charging power.
  • Compatibility in both Apple / Android devices, other devices such as USB charging, MP3 players, cameras, and MP3 players, and GPS
  • Benefits include 4 ports, a built-in flashlight, a compass, and Qi wireless charging.

#2. BigBlue 28W Solar Charger (best portable charger)

(Source: zdnet.com)

  • This solar charger includes features such as 28W, USB-C cable, and waterproof protector which work mostly with Android and Apple devices.
  • The pros are a 3-port design, quick charging speeds, and fantastic durability.

#3. Hiluckey 25,000 mAh Powebank (best for fast charging)

(Source: zdnet.com)

  • Features include 25,000 mAh, the charging time is up to 6 times faster, waterproof, shock and dust resistant.
  • The Pros are a built-in battery pack, charges multiple devices, and a compact design

#4. Jackery Solar generator (best luxury charger)

(Source: zdnet.com)

  • Features include 1534Wh with 1800W, 4 SolarSaga 100W solar panels, and car charger cable.
  • The pros of this device are very efficient, has a reliable operation, and performs in cloudy weather.

Solar Chargers Statistics Charging Stations

  • The global market size of the solar charging station by the end of 2023 is expected to be $0.72 billion and $2.98 billion by the end of 2032, with a CAGR of 19.30% from 2023 to 2032.
  • According to the reports of Market Research Future, in 2022 the largest market was accounted by the North American region with $0.28 billion.
  • On the other hand, the household segment is holding the dominating market accounting for 55% share resulting in $0.34 billion.
  • The on-grid charging station was dominating the market accounting for 60% of the revenue share resulting in $0.37 billion.
  • Whereas, the battery energy storage system segment is a dominant component across the market with a revenue share of 55% resulting in $0.34 billion.

Conclusion

As of today, after completing the article on Solar Charger Statistics it can be stated that solar chargers are known to be versatile as they can be used for charging several electronic devices such as phones, laptops, drones, cameras, etc without any requirement of electric power. The popularity of portable solar chargers is increasing enormously around the world as every year lots of people are opting this for several adventure and outdoor activities.

As of the above report analysis by the end of 2033 the projected global market value is expected to be $13.1 billion. This article includes possible effective statistics for understanding the basic importance of the topic.

Source:: Coolest Gadgets

Apple Vision Pro on sale Feb. 2 in US, pre-orders soon

Home » Archive by Category "Technology" (Page 206)

Fitness Trackers Statistics 2024 – By Market Revenue, Types, Region, Segmentation, Demographics, Apps, Shipments and Brands

Home » Archive by Category "Technology" (Page 206)

By Barry Elad

Introduction

Fitness Trackers Statistics: As of reports, the global market size of fitness trackers is expected to reach around $182.90 billion by the end of 2030 with an annual growth of 19.1% from 2023 to 2030. The industry is progressing rapidly due to the higher integration of consumer-based wearable technologies into health research industries. In this digital world, rising demands of technology are enabling the growth of the fitness tracker industry in the coming years. In addition, after the COVID-19 pandemic, individuals are becoming more dependent on fitness trackers. The article includes several analyses of the market such as revenue share, segmental analysis, demographics, regions, countries, shipments, advantages, etc.

These Fitness Tracker Statistics include insights from various aspects that provide light on how fast the market is growing around the world in recent days.

Editor’s Choice

  • According to the reports of Statista analysis, revenue earned by the worldwide market of fitness trackers is expected to be $67.23 billion by the end of 2023.
  • Whereas, by the end of 2028 the fitness tracker market volume is supposed to reach $103.30 billion with a CAGR of 8.97% from 2023 to 2028.
  • As of 2023, the user penetration of fitness trackers is going to be 5.35% and 6.04% by the end of 2028.
  • By the end of 2023, the expected average revenue per user is predicted to reach $163.70.
  • In 2023, China has earned the highest revenue around the world with almost $23,150 million.
  • As the fitness trackers market is segmented into 3 parts, thus by the end of 2023 average revenue per user in smartwatches ($201.20), Smart bands ($74.87), and smart scales ($44.93).
  • In 2023, revenue was earned from Smartwatches ($44.15 billion), Smart bands ($19.52 billion), and Smart scales ($3.55 billion).
  • As of 2022, the global fitness tracker market share by highest application is running (42.9%), by distribution channel is online distribution segment (62%), and by highest device type is Smart Watches (41.3%)
  • As of reports, the highest fitness market size has been achieved by the North American region resulting in $22.48 billion.

What is a Fitness Tracker?

The fitness tracker is an electronic device that is enabled with various sensors and batteries, which help in tracking orientation, movement, and trails of various, heal-related activities.

Some best fitness trackers cost in 2023 across the globe are Amazfit GTR 4 (costs $200), Garmin Venu Sq 2 (costs $250), Garmin Fenix 7S Pro ($600), Oura Ring Gen 3 (costs $299), Amazfit Band 7 (costs $45), Garmin Vivomove Sport (costs $180), Apple Watch Series 9 (costs $329), Samsung Galaxy Watch 6 (costs $228), Google Pixel Watch 2 (costs $350), and Whoop 4.0 (costs $30).

General Statistics

(Source: mordorintelligence.com)

  • As of the above figure analysis, the global fitness tracker market is expected to grow at a CAGR of 15.70% from 202 to 2028.
  • According to the reports of Fortune Business Insights, the global fitness tracker market size is supposed to reach $53.94 billion by the end of 2023.
  • According to Precedence Research reports, as of 2023 the fitness tracker market size is predicted to be $56.1 billion in 2023 and $258.48 billion by the end of 2032.
  • The global leading manufacturers of fitness trackers are Apple Inc., Fitbit Inc., Garmin Ltd., and Xiaomi.
  • According to Statista, global revenue earned by fitness or activity tracking wrist wearable in 2023 is expected to be $19.3 billion and shipment units are going to be 305 million.
  • As of 2022, fitness tracker market share analysis by distribution channels is followed by online (62%), and offline (38%).
  • Whereas, the overall market growth of the fitness tracker market is expected to reach 18.5% of CAGR from 2023 to 2032.
  • As of reports in the global fitness tracker market, the largest share was achieved by the North American region with a CAGR of 15.5% from 2023 to 2031.
  • According to Adjust report analysis, revenue earned by fitness wristbands and smartwatches is supposed to grow by more than $63 billion by the end of 2023.

Fitness Trackers Statistics by Market Revenue

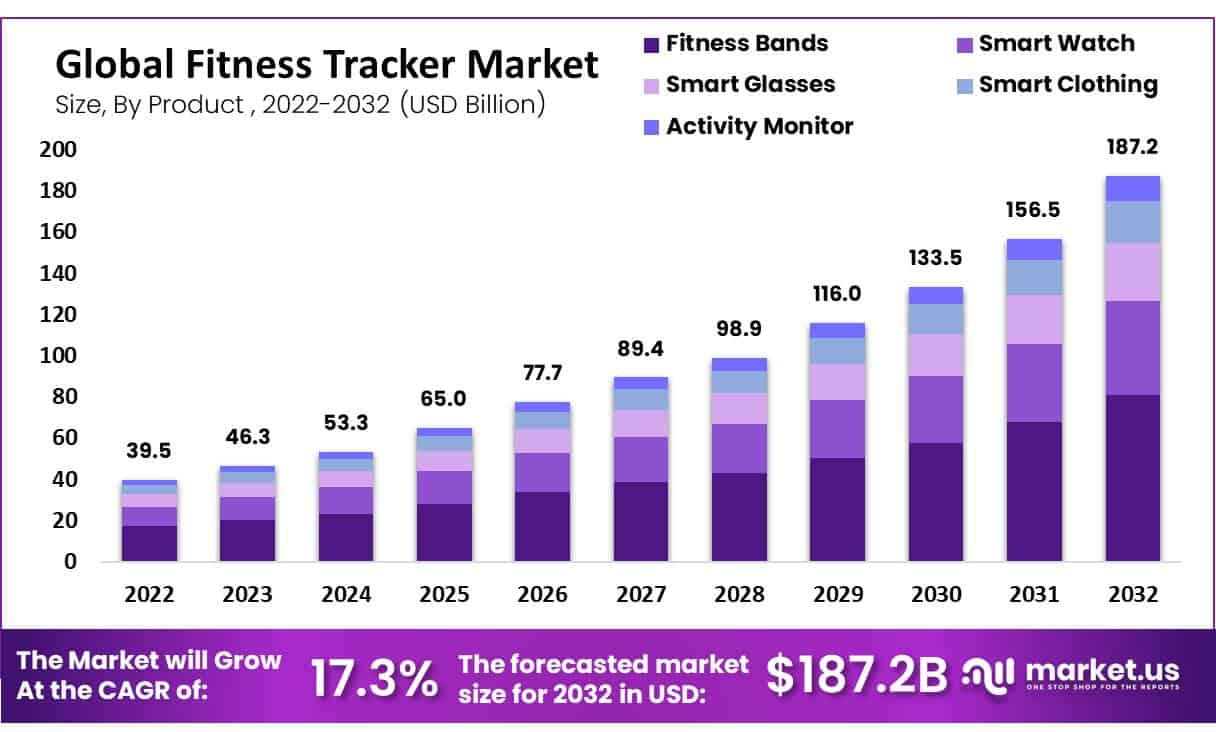
(Source: market.us)

  • As of the above graph analysis, the global fitness tracker market earned maximum revenue from fitness bands, smart glasses, activity monitors, smart watches, and smart clothing.
  • In 2023, the global market valuation of fitness trackers is supposed to be $46.3 billion.
  • The market growth of the global fitness tracker industry is expected to reach higher followed by 2024 ($53.3 billion), 2025 ($65 billion), 2026 ($77.7 billion), 2027 ($89.4 billion), 2028 ($98.9 billion), 2029 ($116 billion), 2030 ($135.5 billion), 2031 ($156.5 billion), and 2032 ($187.2 billion).

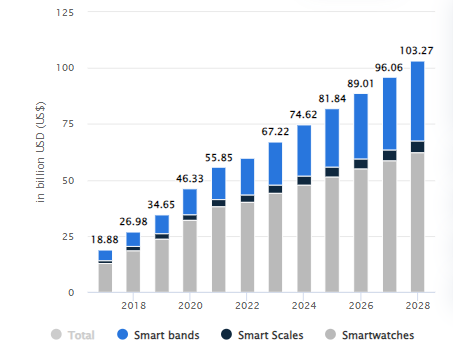
(Source: statista.com)

  • As of the above graph analysis, the market is categorized into 3 segments such as smart bands, smart scales, and smartwatches. Thus, in 2023 global revenue earned by the smart fitness trackers market is expected to reach $67.22 billion.
  • Furthermore, in the coming year revenue rates of the market are supposed to grow more followed by 2024 ($74.62 billion), 2025 ($81.84 billion), 2026 ($89.01 billion), 2027 (96.06 billion), and 2028 ($103.27 billion).

Fitness Trackers Revenue Statistics by Types

-revenue-of-the-digital-fitness-well-being-device-market-worldwide-from-2019-to-2028-by-segment.

(Reference: statista.com)

  • According to the reports of Statista, the fitness tracker’s market is segmented into 3 different segments such as smart bands, smart scales, and smartwatches.
  • In the current year of 2024, the wearable technology market has observed substantial revenue generation with Smartwatches leading at $47.94 billion, followed by Smart bands at $22.78 billion, and Smart scales at $3.89 billion.
  • Moving into the forecast year of 2025, it is anticipated that the market will continue its upward trajectory with Smartwatches expected to generate $51.58 billion, Smart bands poised to earn $26.08 billion, and Smart scales estimated to bring in $4.18 billion in revenue.
  • The growth momentum is predicted to persist into 2026, with revenue from Smartwatches projected to reach $55.16 billion, while Smart bands are forecasted to contribute $29.38 billion, and Smart scales are expected to account for $4.48 billion.
  • In 2027, the market is forecasted to maintain its expansion, with Smartwatches anticipated to generate $58.74 billion, Smart bands expected to earn $32.6 billion, and Smart scales projected to bring in $4.72 billion.
  • Looking ahead to 2028, projections indicate a continued upward trend in revenue with Smartwatches expected to reach $62.46 billion, Smart bands forecasted to contribute $35.84 billion, and Smart scales estimated to earn $4.97 billion.
  • This consistent growth across all categories signifies a robust and expanding market for wearable technology, highlighting the increasing consumer adoption and technological advancements driving the industry forward.

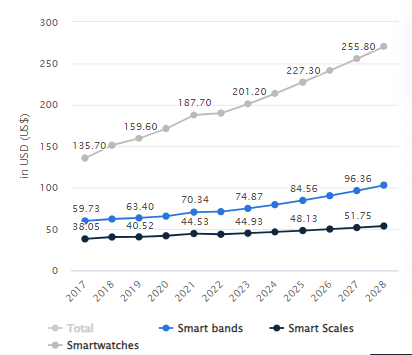
By Average Revenue Per User

(Source: statista.com)

  • As the fitness trackers market is segmented into 3 parts, thus by the end of 2023 average revenue per user in smartwatches ($201.20), Smart bands ($74.87), and smart scales ($44.93).
  • In 2025, the average revenue earned per user is smartwatches ($227.30), Smart bands ($84.56), and smart scales ($48.13).
  • In 2027, the average revenue earned per user is smartwatches ($255.80), Smart bands ($96.36), and smart scales ($51.75).

By Country-Wise Revenue

  • In 2023, China earned the highest revenue in the fitness-tracker market around the world with almost $23.15 billion and $38.38 billion by the end of 2028 with a CAGR of 10.64% from 2023 to 2028.
  • The other top countries revenue earnings in 2023 are followed by the United States ($16.14 billion), India ($5,325 million), Japan ($1,408 million), and the United Kingdom ($1,377 million).
  • Furthermore, revenue earned by the fitness trackers market of other countries in 2023 are Australia ($525.40 million), Bangladesh ($135.40 million), Belgium ($261.80 million), Brazil ($634.30 million), Canada ($6.68.30 million), Colombia ($230.70 million), Denmark ($198.20 million), Egypt ($362.20 million), France ($21,234 million), Germany ($1,259 million), Hong Kong ($95.22 million), Indonesia ($522.70 million), Italy ($916.50 million), Kenya ($25.30 million), Latvia ($20.21 million), Malaysia ($148.10 million), Mexico ($576.10 million), Myanmar ($73.56 million), Netherlands ($377.20 million), Norway ($192.50 million), Philippines ($174.30 million), Russia ($814.30 million), Singapore ($139.80 million), South Africa ($259.60 million), Switzerland ($403.40 million), Taiwan ($123 million), Thailand ($193.20 million), Turkey ($492.50 million), Vietnam ($), and Zimbabwe ($65.48 million).

Fitness Trackers Statistics by Region

(Reference: precedenceresearch.com)

  • As of the above graph analysis, the North American region has accounted for the highest market share with 44% across the global fitness industry in 2022.
  • Furthermore, other regions market shares are followed by Europe (25%), Asia Pacific (24%), Latin America (4%), and Middle East and Africa (3%).
  • The largest share of the fitness tracker market was achieved by the North American region with a CAGR of 15.5% from 2023 to 2031.
  • Whereas, the second largest and fastest growing region is Asia Pacific with a CAGR of 19.5% from 2023 to 2031.

Fitness Trackers Statistics by Segmentation

  • The fitness market around the world is segmented by application, distribution channel, device types, components, connectivity, and operating system.
  • According to Strait Research analysis, based on the application the market growth of the running segment is expected to reach a CAGR of 16.3% from 2023 to 2031.
  • During the forecasted period from 2023 to 2031, based on the distribution channel the offline segment is going to contribute the highest share of 16.5% CAGR.
  • Furthermore, among others based on device types; the highest contributor is the smartwatches segment with a market growth of 16.6% CAGR.
  • Based on components, the highest contributor is the hardware sector with a market growth of 16.9%.
  • Based on connectivity and operating system, the highest contributor is the Bluetooth and Android segment which is estimated to grow by 17.1% and 16.6% of CAGR respectively.

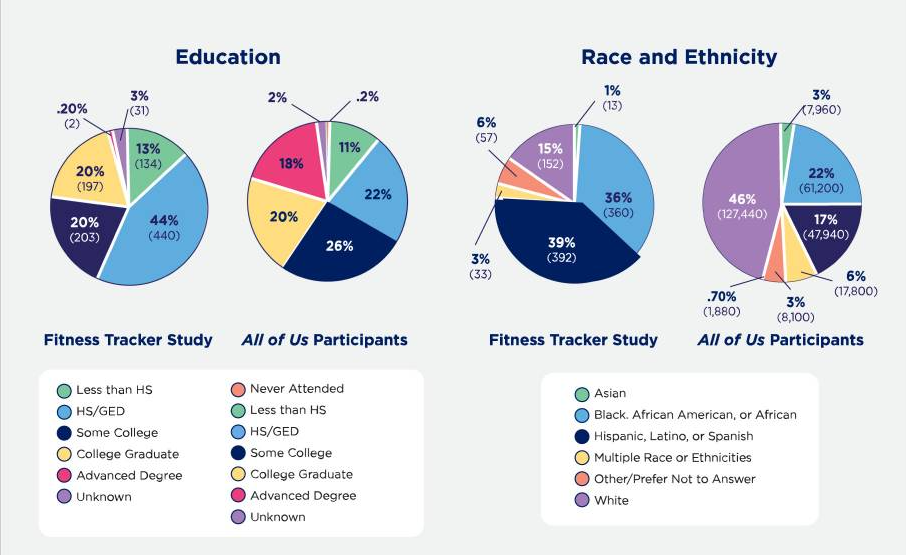
Fitness Trackers Statistics by Demographics

 (Source: ncbi.nlm.nih.gov)

  • According to the survey analysis of the United States National Center for Biotechnology Information, fitness tracker user statistics by race and ethnicity are followed by Hispanic (39%), non-Hispanic black or African American (36%), and non-Hispanic white American (15%).
  • Users of fitness trackers by education are followed by less 9th grade (13%), HS (44%), 2 years college (20%), 4 years college (20%), and no users (3%).
  • Users of fitness trackers by age are followed by 18-25 years (11%), 26-35 years (20%), 36-46 years (20%), 45- 55 years (21%), 56-65 years (19%), 66-75 years (8%), and above 76 years (2%)
  • Users of fitness trackers by gender are followed by women (71%), men (25%), minorities (2%), and others (2%). 

U.S. Fitness Trackers Statistics

  • As of PubMed Central survey analysis, 21% of Americans are using fitness trackers.
  • In which Apple watch users are 11%, others are Fitbit (6%), Garmin (10%), and others (4%).
  • Around 58% of fitness tracker users are mostly used for tracking steps (27%), getting more exercise (16%), and for continuous analysis of heart rate (14%).

(Source: nitrocdn.com)

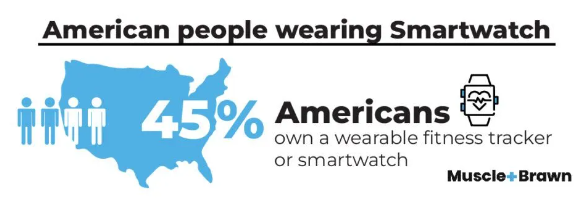
  • Across the world in 2023, almost 45% of Americans are using wearable fitness trackers or smartwatches.
  •  20% of people preferred Apple fitness trackers and 16% preferred Fitbit fitness trackers.
  • 58% of people those are having annual income between $75,000 to $90,000 own fitness trackers.
  • In the United States of America, owners of fitness trackers are Gen Z (70%), Millennials (57%), and women (51%).
  • The main reasons for wearing fitness trackers are for tracking stress management (30%), exercise routine (27%), nutrition and diet (26%), and daily accumulated steps (24%).

Fitness Trackers Statistics by Brands

 (Reference: headphonesaddict.com)

  • As of reports 2022 in the United States, fitness tracker user statistics by brand are followed by Apple (46%), Fitbit (38%), Samsung (16%), Garmin (8%), LG (7%), and Huawei (5%).

(Reference: sammyfans.com)

  • As of 2023 reports, the global market of Apple fitness tracker is expected to be 32% of the share.
  • As of the above graph analysis, the market share of top manufacturers of fitness trackers is followed by Samsung (10%) Huawei (7%), Garmin (4%), Fitbit (1%), and others (46%).

Indian Fitness Trackers Statistics

  • According to reports of Statista, revenue earned by the Fitness-tracker market is expected to reach around $ 5,325 million by 2023 with a revenue growth of 38.8% from last year.
  • By the end of 2028, the market volume is going to reach around $14,200 million with a CAGR of 21.67% from 2023 to 2028.
  • As of 2023, the expected average revenue per user is supposed to reach $128.90.
  • Whereas, the user penetration rate in 2023 is 4.91% and 7.76% by 2028.

Fitness Trackers Statistics by Apps

(Source: verifiedmarketresearch.com)

  • As of the above graph analysis, the global health and fitness app market is expected to be $35.71 billion with a CAGR of 20.02% from 2022 to 2030.
  • According to recent reports analysis, 81% of customers around the world in 2023 have planned to use fitness tracker apps on wearables as well as on Smartphones.
  • As of 2023, the market valuation of the fitness trackers apps industry is expected to reach $19.3 billion and $33.04 billion by the end of 2027.

(Source: storyblok.com)

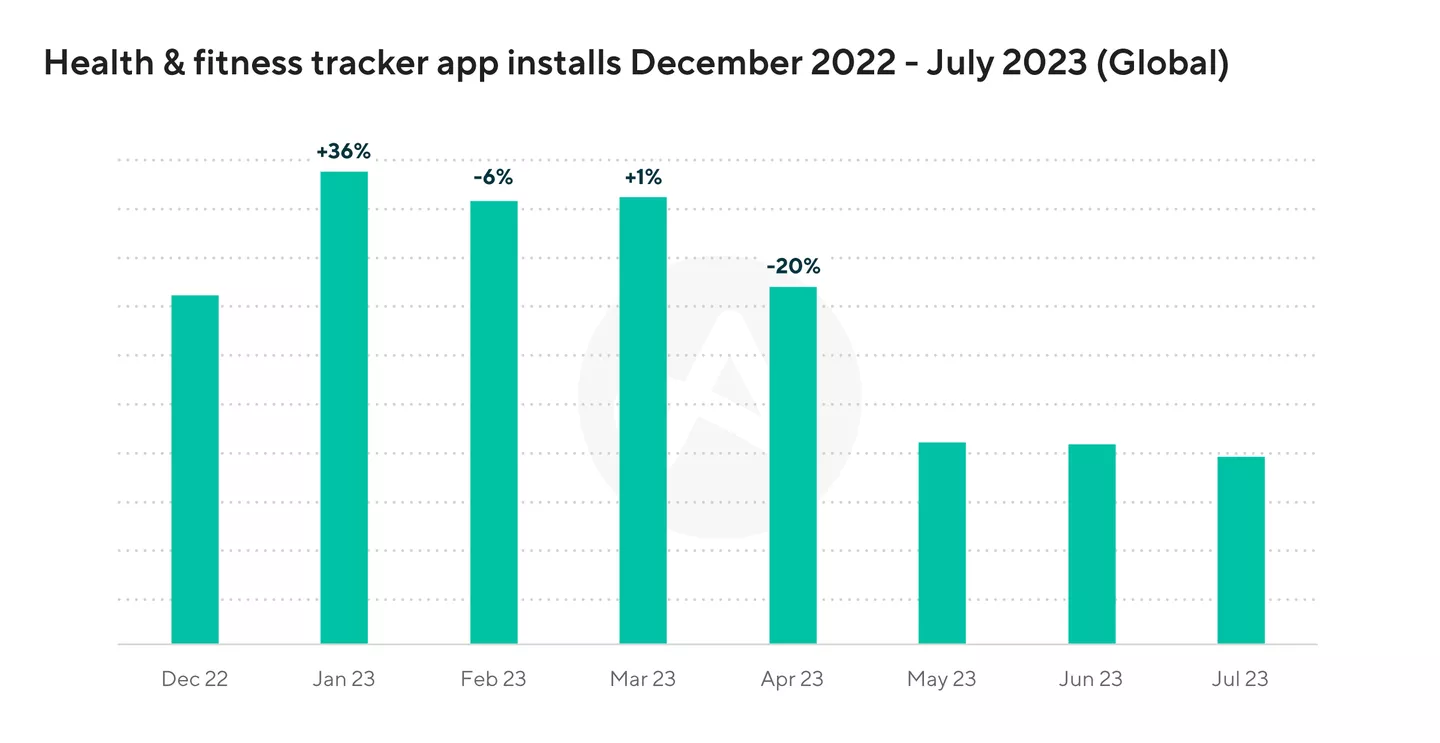
  • In January 2023, global installments of health and fitness tracker apps have increased by 36% from the last months.
  • Furthermore, global installments in the next months of 2023 are followed by February (-6%), March (+1%), and April (-20%).

Fitness Trackers Statistics by Shipments

  • According to Volza’s Global Reports 2023, the import and export shipment of fitness trackers around the world is 2.2K.
  • Top importers of fitness trackers shipments are followed by India (1,069), the United States (210), and Bangladesh (145).
  • The top 3 product categories that are imported around the world are HSN Code 85176290, HSN Code 90318000, and HSN Code 90291090.
  • Top exporters of fitness trackers statistics by shipments are followed by China (1,260), the United States (410), and India (138).
  • The top 3 product categories that are exported around the world are HSN Code 85176290, HSN Code 90291090, and HSN Code 90318000.
  • As of reports, in 2023 there are 538 buyers and 421 suppliers spread across 45 and 32 countries respectively.
  • Top country buyers are followed by India (108), the United States (58), and the Philippines (50).
  • Top country suppliers are followed by India (1059), the United States (207), and Bangladesh (124).

Conclusion

After completing the article on Fitness Tracker Statistics, it can be stated that this technological device market is growing rapidly around the world due to its beneficial capability of tracking several physical fitness activities. This article includes several statistical analyses that will positively motivate people across the world so, that they can understand the importance of fitness trackers and can buy one for themselves or family members to enjoy the effective benefits of this device.

Source:: Coolest Gadgets

How geothermal energy from old coal mines could heat UK homes

Home » Archive by Category "Technology" (Page 206)

By Siôn Geschwindt

The same tunnels used to extract fossil fuels for centuries are now helping to heat British homes with clean energy from the Earth’s core. It’s called mine water heating and it has the potential to provide critical warmth to hundreds of thousands of homes in the country’s north. At least one quarter of UK homes sit above abandoned coal mines. Residents in these towns and cities concurrently grapple with skyrocketing energy bills. Tapping mine water heat from beneath their feet could be a win-win for these communities. And the technology is already in operation. Last year, one of the largest…

This story continues at The Next Web

Source:: The Next Web

Dutch startups created 151K jobs in the Netherlands in 2023

Home » Archive by Category "Technology" (Page 206)

By Ioanna Lykiardopoulou

The Netherlands is among Europe’s biggest tech ecosystems, not only driving innovation but employment as well. According to a report by Dealroom, in 2023, Dutch startups created 256,000 jobs globally and 151,000 jobs spread across over 50 cities in the country. Age and size matter Last year marked the first time that startups founded between 2011 and 2017 offered as many jobs as companies founded up to 2005, including early big successes such as Booking and TomTom. Meanwhile, the youngest group of companies, which were those founded since 2018, supported 23,600 jobs — showing the fastest growth rate year-on-year. Size-wise,…

This story continues at The Next Web

Source:: The Next Web

MediaTek Processor Naming Scheme Explained: Smartphones & Laptops

Home » Archive by Category "Technology" (Page 206)

By Hisan Kidwai

In recent years, MediaTek has staged a comeback in the budget to mid-range smartphone market, powering devices like the Motorola Edge 40 and the Realme 11 Pro Plus. However, unlike Qualcomm, which has adopted a unified naming system to help users distinguish between its offerings, MediaTek’s processor naming scheme is convoluted and lacks specific meaning….

The post MediaTek Processor Naming Scheme Explained: Smartphones & Laptops appeared first on Fossbytes.

Source:: Fossbytes

Upcoming iPhone 16 Pro Series: Launch Date, Specs And Price

Home » Archive by Category "Technology" (Page 206)

By Hisan Kidwai

Image of the iPhone 16 Prop colors

The iPhone design has remained largely consistent, with the company making incremental changes to refine the user experience. However, a recent leak from AppleTrack has hinted at significant alterations in the upcoming iPhone 16 Pro series. As a result, here is everything you need to know about the upcoming iPhone 16 Pro and Pro Max….

The post Upcoming iPhone 16 Pro Series: Launch Date, Specs And Price appeared first on Fossbytes.

Source:: Fossbytes

Startup firm Patronus creates diagnostic tool to catch genAI mistakes

Home » Archive by Category "Technology" (Page 206)

How the Ukrainian startup behind astrology app Nebula is thriving despite the war

Home » Archive by Category "Technology" (Page 206)

By Linnea Ahlgren

Running a tech startup is a challenging endeavour under any circumstances. Imagine doing it under invasion with air raid sirens going off on average twice every 24 hours — and managing to grow 250% in the process.  This is the story of OBRIO, a Ukrainian startup behind the successful astrology app Nebula. Speaking to TNW from his apartment in Kyiv just before the turn of the year, founder and CEO Alex Fedorov says that running a company during wartime is not exactly something you learn in business school. Fedorov sees the process as twofold. “There was the initial one when…

This story continues at The Next Web

Source:: The Next Web

TNW Podcast: Tomas Hrozensky (ESPI) on policy in space

Home » Archive by Category "Technology" (Page 206)

By Andrii Degeler

 In this bonus episode of the TNW Podcast, we’re featuring an interview with Tomas Hrozensky, Senior Researcher and Lead on European Engagement at the European Space Policy Institute. We discussed how space policy actually works (and whether it works at all), what to expect from the EU space law that’s being developed as we speak, and much more. Listen to the episode with the player above — or, better still, find us on your favourite podcast platform and subscribe! Music and sound engineering for this podcast is by Sound Pulse. Feel free to email us with any questions, suggestions,…

This story continues at The Next Web

Source:: The Next Web

2024 will be ‘The year of AI glasses’

Home » Archive by Category "Technology" (Page 206)

Apple’s pricey Vision Pro augmented reality platform is expected to arrive in the first quarter of 2024. But by the end of the year, I predict the platform of the year will be — drum roll, please — AI glasses!

Wait, what?

That’s right. Glasses that let you interact with artificial intelligence (AI) from the comfort of your own face will be the sleeper hit of the year. In fact, the buzz around market leader Meta has already begun.

Announced in September and shipped in October, the Ray-Ban Meta glasses arrival was initially received with a collective shrug. They were assumed to be camera glasses, like Snap Spectacles, or virtual assistant glasses, like Amazon’s Echo Frames. Or, for that matter, a small upgrade from their Meta predecessor, Ray-Ban Stories. But Spectacles, Echo Frames and Ray-Ban Stories failed to thrill the gadget-loving public.

To read this article in full, please click here

Source:: Computer World

The best MasterClass courses for 2024

Home » Archive by Category "Technology" (Page 206)

Apple is a big-noise no-show at CES 2024

Home » Archive by Category "Technology" (Page 206)

CES is coming, and if the past is any guide, Apple won’t be part of the festivities. And yet, as is often the case, its presence will be felt across the exhibition floor.

Why? Because while generative AI (gen AI) might this year appear in everything (for good or ill), the other big story will be augmented reality (AR) — and Apple’s much-ballyhooed Vision Pro hasn’t even hit the market yet.

You can tell this is so by the rash of Vision Pro rumors, speculation, and claimed design and usage leaks emerging like clockwork in the run up to CES.

To read this article in full, please click here

Source:: Computer World

Wireless Gaming Mouse Statistics 2024 – By Technology, Weight, Polling Rate, Shipment, Buyers and Suppliers

Home » Archive by Category "Technology" (Page 206)

By Rohan Jambhale

the-global-market-size-of-the-wireless-gaming-mouse-

Introduction

Wireless Gaming Mouse Statistics: As of recent market research reports, the global market size of the wireless gaming mouse is expected to reach up to $2.55 billion by the end of 2032. The wireless mouse segment is gaining huge popularity across the world as it includes Bluetooth technology and is mostly used in gaming devices.

The most recent version used in wireless mouce is Bluetooth 5.0 which enables high-speed data transfer and low latency. In recent days, gamers have shown more interest in wireless gaming mouse as they cover several effective features such as adjustable RGB illumination, high DPI, and programmable buttons.

(Reference: custommarketinsights.com)

What is a Wireless Gaming Mouse?

The gaming wireless mouse is specially designed for computer gamers. This mouse enables a wide array of controls and buttons along with palm, Claw, and Finger-Tip Grip. The high-quality features are precision and speed make the overall process easier.

Editor’s Choice

  • According to the reports of customer market insights, the market size of the gaming mouse industry around the world is supposed to be $1.83 billion.
  • On the other hand, the expected growth is predicted to reach 7.5% at a CAGR from 2023 to 2032.
  • In the last year 2022, the market valuation was slightly less as of recent day with $1.76 billion.
  • The effective features of a wireless gaming mouse include high-DPI sensors, customizable buttons, ergonomic designs, RGB lighting, software customization, polling rate, and weight customization.
  • According to the reports of market.us, the global market size of wireless mice in 2023 is expected to reach $3,123.5 million and by the end of 2032, the market valuation is going to reach above $5,599.2 million.
  • The global wireless mouse market is segmented into RF Wireless gaming mice, IR wireless mice, and Bluetooth wireless gaming mice.
  • The largest market share of wireless gaming mice was captured by the North American region with 39%.

Facts of Wireless Gaming Mouse

(Source: reportsanddata.com)

  • According to the reports of data intelligence, it is estimated that almost 2.2 billion to 2.6 billion people around the world will be using wireless gaming mouse in 2023.
  • In the United States, the largest technology market is expected to be $1.7 trillion with a 32% share across the world tech market.
  • As of recent days, the fastest growing region is the Asia Pacific region.
  • According to the reports of Skyquest, the global market size is expected to reach above $3.62 billion in 2023 and it is going to be $6.61 billion by the end of 2030.
  • The expected wireless mouse market size is going to reach a CAGR of 7.6% from 2023 to 2030.
  • As of 2023 reports, around 60% of American residents have already purchased wireless gaming mouse from offline stores.
  • The leading manufacturers of the industry are Razer, HyperX, Logitech, HyperX, Microsoft, Dell, Apple, ASUS, Lenovo, etc.

Click Latency Statistics

(Source: voltcave.com)

  • Due to the advancement of wireless technology, latency-wise the performances of a wireless gaming mouse are better than those of a wired mouse.
  • According to the reports of Voltcave, Optimum Tech tested much high-quality wireless gaming mouse to check out a better click latency rate.
  • The wireless mouse click latency rate of Razer Viper Ultimate is 15.2 milliseconds (ms), others are followed by Logitech G Pro X Superlight (15.9 ms), Logitech G 305 (19.8 ms), Steelseries Aerox 3 (22 ms), Glorious Model O Wireless (26.7 ms), and Pwnage Ultra Custom Symm (28.7 ms).

Wireless Gaming Mouse Statistics by Technology

  • The wireless gaming mouse deals with 3 technologies RF, IR, and Bluetooth.
  • RF (radio frequency) Mouse works through a 2.4 GHz ISM Band. This technology especially requires 2 components radio transmitter and receiver.
  • IR (Infrared) Mouse is integrated with a Dot per Inch shift button to adjust all gaming needs. The Anker 2.4G wireless mouse after adopting infrared technology enables amazing technology.

Wireless Gaming Mouse Statistics by Weight

-how-heavy-should-your-be-gaming-mouse-be

(Reference: kitguru.net)

  • According to the reports of Kitguru, the demand for light-middle gaming mouse (91-100 gm) is the highest demand for products for 23% of survey respondents.
  • Furthermore, other weights of gaming mouse statistics preferred by respondents are middle heavyweight (11-130 gm) =19% of respondents, lightweight (130 g) = 11%.
  • Whereas, 34% of people have said that the weight of a mouse is not the important factor.

Wireless Gaming Mouse Statistics by Polling Rate

According to the reports of Gamingsetup 2023, the minimum polling rate of gaming mice is 1000Hz. As this enables the best and most balanced performance level with a delay of 1 millisecond, CPU load, and battery life.

Polling Rate Total Delay
125 Hz 8 ms
250 Hz 4 ms
500 Hz 2 ms
1000 Hz 1 ms
4000 Hz 0.25 ms

Wireless Gaming Mouse Statistics by Shipment

  • According to the reports of Volza Grow Global, around the world, there are 617 active wireless mouse importers with an average of 475 suppliers.
  • As of 5th December 2023, around 70 countries are linked with the import and export of gaming wireless mouse.
  • Whereas 3.9K import shipments are found around the world, country-wise import shipment units are followed by the United States (1034), India (703), Vietnam (562), Peru (358), Indonesia (291), Philippines (204), and Ukraine (184).
  • The export units of gaming wireless mouse are followed by China (2753), Hong Kong (315), Vietnam (215), Singapore (156), and Turkey (124).
  • The maximum import market share is accounted for by ACRO ENGINEERING COMPANY with 224 shipments.
  • Followed by RASHI PERIPHERALS PVT LTD with 174 shipments and EXPORTADORA IMPORTADORA IGARASHI with 160 shipments.

Wireless Gaming Mouse Statistics by Buyers and Suppliers

  • As of reports, in 2023 there are 617 buyers available in 51 countries.
  • The top buyers of gaming wireless mouse is the Philippines with 128, other are followed by the United States (96), Vietnam (85), and Pakistan (56).
  • On the other side, there are 475 global suppliers of gaming wireless mouse across 26 countries.
  • The top supplier is China accounting for 294 units.

Top Wireless Gaming Mouse Statistics

 RAZER-VIPER-V2-PRO

  • The best wireless gaming mouse is the Razer Viper V2 Pro with a lighter version l that enables accurate and faster movements.
  • The device includes a new Razer Focus Pro 30K sensor and a default weight of 58.5 g.
  • This is available at Amazon which cost almost $30
  • Benefits include extremely lightweight exceptional click latency, comfortable symmetrical shape, feet glide remain very smooth over mouse pads, and built quality is excellent.

 Logitech-G502-LIGHTSPEED(Source: rtings.com)

  • Logitech G502 LIGHTSPEED (Best for upper mid-range) It is comfortable right-handed with a thumb rest along with twelve programmable buttons.
  • This is available at Amazon.com and BestBuy.com which cost around $100 and the default weight is around 115.1 g.

 Fantech-Aria-XD7

(Source: rtings.com)

  • Fantech Aria XD7 (best for mid-range) its size is symmetrical, with a comfortable egg-like shape and size, and is super lightweight (59 g).
  • The features include Pixart 3395 gaming sensor with 26000 DPI, 5G Advanced 18K Optical Sensors, 285 Hr Battery for Hyper Speed Wireless, Gen-2 Mechanical Switches, Chroma RGB, 535 Hr Battery for Bluetooth, and 9 Programmable Controls.

Razer-Basilisk-V3-Hyper-Speed

(Source: rtings.com)

  • Razer Basilisk V3 Hyper Speed (best for lower mid-range) has excellent build quality, an ergonomic right-handed shape, and low click latency rates.
  • The advanced features are Gen-2 Mechanical switches, 5G Advanced18K optical sensors, Chroma RGB 9 with programmable controls 535 Hr Battery.
  • The cost is almost $50 and a default weight of 113.8g

Logitech-G305-Light-Speed

(Source: rtings.com)

  • Logitech G305 Light Speed (best for budget) includes next-gen HERO mouse sensors that deliver power efficiency above 10x.
  • Other effective feature includes ultra-fast light speed that enables a lag-free gaming experience with incredible reliability and responsiveness with a super-fast 1ms report rate.
  • The mouse boasts incredible control of a 250-hr battery and a maximum speed of >400 IPS.

Conclusion

As of today, after completing the article on Wireless Gaming Mouse Statistics it can be stated that the industry has started growing in the last few years. This gaming mouse transmits radio signals to the receiver which is connected to the computer. This mouse doesn’t have cable or wire and can be managed easily on laptops and desktops in any situation. This article includes possible data such as market share, shipment units, imports; exports, etc hopefully will help in understanding the basic importance of the topic.

Source:: Coolest Gadgets

Cloud Gaming Service Statistics 2024 – By Type and Subscribe Rate

Home » Archive by Category "Technology" (Page 206)

By Barry Elad

Introduction

Cloud Gaming Service Statistics: According to reports, the global annual spending on Cloud Gaming Services is expected to reach above $6 million by the end of 2024. The cloud gaming services helped developers concentrate on optimizing games for specific hardware devices along with enabling cost cost-saving processes for developers. Thus, global expansion is driving out enormously around the world and is expecting continuous growth in the coming future.

These Cloud Gaming Services Statistics include insights from various aspects that provide light on why Cloud Gaming is one of the best streaming services today.

Editor’s Choice

  • According to the reports of Gitnux, by 2030 the expected cloud gaming service market is going to reach above $21 billion.
  • As of survey reports, 50% of consumers have played cloud gaming via cloud services in 2023 around the world.
  • In the United States, 43% of cloud gamer subscriptions are currently subscribed to PlayStation.
  • According to the reports of Kevuru Games by the end of 2027, the predicted compound annual growth rate of the cloud gaming industry is expected to grow by 44.13% from 2023 to 2027.
  • According to Research Nester reports, the market of cloud gaming services market is expected to reach over 50% of CAGR from 2022 to 2030.
  • The leading players in the Cloud Gaming industry are Tencent Holdings Ltd., Intel Corporation, Ubitus K.K., RemoteMyApp Sp.z o.o., LP Technologies, etc.
  • According to the reports of Statista, the heavily investing companies in cloud gaming services are Google, Microsoft, and Amazon.
  • By the end of 2023, the overall revenue earned by the cloud gaming market is supposed to be $4.34 billion with a CAGR of 39.32% from 2023 to 2028.

What are Cloud Gaming Services?

Cloud gaming are advanced streaming service those are implemented with enhanced technology that provides content of high quality at the cost of server capacity and internet bandwidth. These cloud gaming services are different from other gaming servers as they act as consumer-centric products and offer several games from various categories with effective subscription fees.

The best features of cloud gaming services are independence to game anywhere, can be played mostly on all devices such as iPhones, Android, Linux, Mac, Windows, etc.

General Statistics

  • According to the reports of Statista 2023, the demand for cloud gaming services has increased around the world due to the increasing high-speed internet accessibility along with the growing popularity of gaming.
  • The estimated market revenue earned by the United States in the cloud gaming industry is almost $1,277 million.
  • In 2023, the user penetration rate of the overall industry is 3.8% and is expected to increase up to 6.3% by the end of 2028.
  • The average revenue per user in 2023 is going to be accounted around $14.70.
  • By the end of 2023, the overall revenue earned by the cloud gaming market is supposed to be $4.34 billion with a CAGR of 39.32% from 2023 to 2028.
  • The top 5 cloud gaming market companies are Alibaba Group Holding Ltd., Alphabet Inc., Amazon.com Inc., Apple Inc., BLACKOUT

(Source: technavio.com)

  • North America is the key region of the cloud gaming market and is estimated to grow at a CAGR of 48% by 2027.

Facts of Cloud Gaming

  • According to the reports of Scoop Market, in the cloud gaming services, Amazon Luna and Google Stadia have received higher satisfaction levels with 69% and 58% respectively.
  • From 2021 to 2027, the market growth of cloud gaming services in the Asia Pacific region is expected to grow at a CAGR of 66.2%.
  • As Statista reports, revenue earned by the North American region is going to be $1.42 billion by the end of 2023.
  • Europe is going to earn market revenue of around $1.11 billion in 2023 and in the African region; it is expected to be $37.39 million by the end of 2028.

number-of-subscribers-of-playstation-plus-ps-plus-worldwide-as-of-march-2023.

(Reference: statista.com)

  • As of March 2023, the total number of PlayStation Plus Premiums around the world was almost 47.4 million.
  • The subscription rate remained highest in December 2021 with around 48 million subscriptions in the cloud gaming services.
  • In the United States, the brand awareness of Amazon Luna is 39% in 2023.
  • Whereas,13% of U.S. video game subscribers have preferred using Amazon Luna and by the end of 2023 almost 11% of video game subscription users are likely to use Amazon Luna again.
  • As of June 2023, around 16% of subscribers in the U.S. have just heard about Amazon Luna.
  • In May 2023, approximately 6% of the United States people have subscribed to Amazon’s cloud gaming subscription service and Amazon Luna+

Global Revenue of Cloud Gaming

cloud-gaming-worldwide-revenue.

(Reference: statista.com)

  • According to the Statista report analysis, the revenue earned by the cloud gaming market in 2023 is expected to be $4.43 billion.
  • Furthermore, in coming years expected market revenue earned is followed by 2024 ($6.91 billion), 2025 ($10.46 billion), 2026 ($14.64 billion), 2027 ($18.71 billion), and 2028 ($22.78 billion).

Best Cloud Gaming Services

Xbox-Game-Pass-Ultimate

(Source: futurecdn.net)

  • Xbox Game Pass Ultimate (per month costs $10 to $15)
  • These are used in PC, Xbox One, Xbox Services X/S, mobile, Web browser, and smart TV with a resolution above 1080p.
  • The network requirements are 20 Mbps or 10 Mbps

Nvidia-GeForce-Now

(Source: futurecdn.net)

  • Nvidia GeForce Now (monthly costs $20)
  • The platform usages are PC, Mac, Chrome OS, Web browser, mobile, and Smart TV with resolutions up to 4K.
  • The required network of cloud gaming services is 45 Mbps or 15 Mbps.

PlayStation-Plus-Premium

(Source: futurecdn.net)

  • PlayStation Plus Premium (monthly cost is around $18)
  • These are used in PC, PS4, and PS5 with resolutions up to $1080p.
  • The network requirements are 15 Mbps and 5 Mbps.

Amazon-Luna

(Source: futurecdn.net)

  • Amazon Luna (costs $10 per month)
  • They are used on PCs, Macs, Amazon Fire devices, mobile, and smart TVs,
  • Resolution used above 1080p and network requirement is above 10 Mbps.

Cloud Gaming Services Subscription Statistics by Type

share-of-gamers-in-the-united-states-who-subscribe-to-xbox-game-pass-as-of-may-2023-by-type

(Reference: statista.com)

  • According to Statista survey reports 2023, in the United States 32% of gamers have subscribed to Xbox Game Pass.
  • As of May 2023, the Xbox Game Pass is segmented by types followed by total gamers are about 13%, interested in cloud gaming (20%), and used cloud gaming in the last month (24%).
  • Nvidia GeForce Now subscription rate among U.S. gamers is approximately 3% of subscribed respondents.
  • According to the reports of Maru Entertainment and Technology, 50% of gamers have heard about cloud gaming services, 41% of gamers never heard, and 9% are not sure.

Cloud Gaming Services by Subscribe Rate

cloud-gaming-serviced-subscribe-to(Reference: marugroup.net)

  • According to the reports of Maru Group, 16% of people have subscribed cloud gaming services of Xbox GamePass Ultimate.
  • Furthermore, other cloud gaming services of subscriber statistics are followed by PlayStation Now (15%), Amazon Luna (10%), Google Stadia (9%), NVIDIA GeForce Now (6%), Shadow (5%), Blacknut (5%).
  • Other less subscribed cloud gaming services are Vortex (4%), Rainway (4%), Paperspace (4%), NetBoom (3%), PlayKey (3%), and Boosteroid (3%).

Gaming Industry Statistics Cloud Computing Services

  • According to the reports of Rapyder, the global market share of cloud gaming is expected to increase by $90.8 billion by the end of 2025.
  • As of 2023, in India, the cloud gaming market is around $2.6 billion and by the end of 2027, it is expected to be $8.6 billion.
  • The fastest-growing region of the cloud gaming industry is Asia Pacific, which is expected to reach a CAGR of 10.5% from 2021 to 2026.
  • In the global cloud gaming industry 50% of market share is accounted via mobile games in 2023.

Advantages of Cloud Gaming Services

GeForce Now

  • This is commonly termed as NVIDIA GRID and this is the oldest cloud-based gaming platform.
  • This enables full HD 1080p video quality without any input lag along with supporting different platforms such as Steam, Epic, Uplay, and Battle.net.

Shadow

  • This service is accessible within high-end gaming computers along with enabling performance levels up to 144 Hz (Full HD), and 60 Hz (4K UHD).
  • For effective and smooth services the minimum internet speed requirement is 15Mbps.
  • Whereas, the cloud storage ranges between 256 GB to 2 TB Applications used are Windows, macOS, Android, i0S, Android TV, AND Apple TV.

PlayStation Now

  • The monthly subscription rate of this service is around $9.99.
  • This is available in 12 countries such as Switzerland, The Netherlands, Austria, Belgium, Canada, Ireland, Japan, Luxembourg, the UK, France, Germany, and the USA.
  • This is comparatively cheaper than other cloud gaming services.

BlackNut

  • The monthly subscription rate of BlackNut is around $12.99, as of 2023.
  • On this platform, more than 500 games are available in different genres.
  • The option of parental control is available for creating 5 different accounts.
  • The most used applications are Windows, macOS, Amazon Fire TV, Android, and some selected smart TVs.
  • Available both on Chromecast as well and Firestick.

Xbox Cloud Gaming

  • According to Techworm reports, this service supports more than 100 gaming titles which require a minimum internet speed of 7-10 Mbps.
  • More than 100 video gaming titles are available.

Conclusion

As of today, after completing the article on Cloud Gaming services it can be easily stated that the market share as well as popularity of cloud gaming is growing enormously around the world. In recent years the most exciting innovation is cloud gaming and the best available cloud gaming services are GeForce Now, Shadow, PlayStation Now, BlackNut, Vortex, and Xbox Cloud Gaming. This article includes possible effective statistics hope, will help in understanding the topic effectively.

Source:: Coolest Gadgets

REGISTER NOW FOR YOUR PASS
 
To ensure attendees get the full benefit of an intimate technology expo,
we are only offering a limited number of passes.
 
Get My Pass Now!