Planned Adobe app to put an end to AI training on images and clips

Adobe has unveiled plans for a new web app called Content Authenticity, which is part of the Content Credentials platform and will be used to ensure that AI models are not trained on content creators’ images, video, or audio clips without their permission.
The app can be used with all images and clips, not just those created with Adobe’s software, according to The Verge.
A public beta version of Content Authenticity will be released in the first quarter of 2025, the company said. All that is required is a free Adobe account, meaning users don’t need a paid subscription to use the web app.
Source:: Computer World

Big shift in IT employment shows new skills are needed
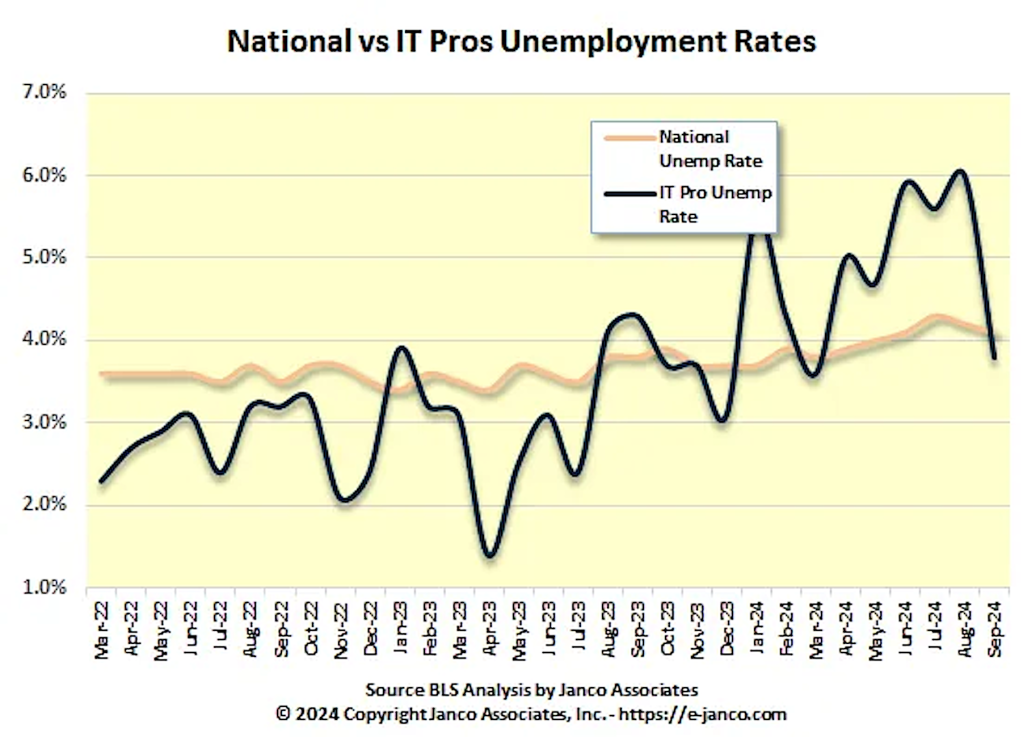
Multiple research firms reported that the unemployment rate for IT workers dropped precipitously last month — in one instance, by nearly 37% — a decline that marked a serious shift from months of incremental increases mixed with plateaus in unemployment.
Tech industry watchers say the dramatic uptick in hiring is the result of several factors, including a strengthening economy, AI-related talent needs, and increased hiring by small-to-midsize companies.
Smaller organizations have also been scooping up talent left in the wake of more than two-years’ worth of layoffs by mega corporations. Last month, the number of unemployed IT professionals in the US dropped from 148,000 to 98,000, according to IT industry consultancy Janco Associates. Janco derived its findings from a US Bureau of Labor Statistics (BLS) report released last week.
More than 78,000 IT pros were hired in September, cutting into the backlog of unemployed. “IT Pros who were unemployed last month found jobs more quickly than was anticipated, as CIOs rushed to fill open positions,” said Janco CEO Victor Janulaitis. “Our analysis predicts the same will be the case for the next several months.”
Janco pegged the September unemployment rate for IT workers at 3.8%, down from 6% in August. IT unemployment is now below the overall national unemployment rate of 4.1%, according to Janco.
Over the year, Janco has reported IT unemployment rates that were far higher than other organizations’ figures. For example, nonprofit IT association CompTIA said tech unemployment dropped from 3.4% in August to 2.5% in September; that still represents a 26.5% drop.
Janco’s numbers are calculated differently from CompTIA’s and the firm’s report showed the overall unemployment rate for IT pros grew from 5.6% in July to 6% in August. (High unemployment is defined by the BLS as being 5.5% or greater.)
Janco Associates
Janco’s figures, in fact, showed IT unemployment had surpassed the national unemployment rates for seven of the last eight months. But in September, that shifted dramatically.
“There are now approximately 4.18 million jobs for IT professionals in the US,” said Janulaitis. “Layoffs at big tech companies continued to hurt overall IT hiring. Large high-tech firms continue to lay off to have better bottom lines. Included in that group of companies that have recently announced new layoffs are Intel, Microsoft, and Google.”
Janco’s current forecast is for the IT job market to grow slightly, between 5,000 and 6,000 jobs the remainder of 2024. That, however, will not be enough to absorb all unemployed IT pros looking for work.
AI part of the hiring boom?
Martha Heller, CEO of Heller Search, a tech executive headhunter firm, said a significant portion of the $600 billion that has already been invested in AI technologies by organizations is going to talent — and not just AI talent. “To get ROI from AI, most companies need to hire more data engineers, cybersecurity leaders, and developers in addition to modelers and prompt engineers,” Heller said.
Through 2027, generative AI (genAI) will spawn new roles in software engineering and operations, requiring 80% of the engineering workforce to upskill, according to research firm Gartner. A Gartner survey of software engineering leaders found that 56% rated AI and machine learning engineer as the most in-demand role for 2024.
While AI will make engineering more efficient, organizations will need even more skilled software engineers to meet the rapidly increasing demand for AI-empowered software. “Bold claims on the ability of AI have led to speculation that AI could reduce demand for human engineers or even supplant them entirely,” said Philip Walsh, a Gartner senior principal analyst. “While AI will transform the future role of software engineers, human expertise and creativity will always be essential to delivering complex, innovative software.”
IT workers are paying attention to the need to bolster their skills. A survey by genAI tech company Amdocs of 500 full-time workers who use Gen AI-powered tools or software showed half of Gen Z respondents would consider looking for a new job if their company did not train them on the technology. That compared to 37% of Gen X and 27% of Baby Boomers who said the same thing.
“Many of the larger firms continue to be focused on improvements in productivity and replacing lower-level skills with AI applications,” Janulaitis said, noting that AI continues to slow the growth of entry-level IT positions, especially in customer service, internal reporting, telecommunications, and hosting automation.
C-level executives continue to focus on eliminating “non-essential” managers, staff, and services, he said. “Experienced coders and developers have limited opportunities with legacy applications. The highest demand continues to be for AI, security professionals, new technology programmers, and Internet processing IT pros.”
A closer look at BLS data for tech hires showed companies are pulling back on hiring AI pros and are instead seeking data researchers who can help businesses make better decisions — whether to advance AI deployments or broader business strategy.
Job openings for tech support specialists and database administrators were up 14%, the largest percent change for the month.
After nine consecutive months of growth, the total number of job postings for AI and machine learning engineers declined by 3.7% in September. And new job postings declined by 13.7% during the same period, according to Ger Doyle, head of Experis North America, a ManpowerGroup tech recruiting subsidiary.
“This is mainly due to shifting demands. While there is less demand for software developers, there is increasing demand for roles such as solutions architects and data scientists to build robust data foundations,” Doyle said.
Source:: Computer World
AI is changing science: Google DeepMind duo win Nobel Prize in Chemistry
OpenAI deepens European footprint with new hubs in Paris, Brussels
Is the .io top level domain headed for extinction?

Message to all organizations that use .io domain names, of which there are currently an estimated 1.6 million: A move announced last week by the new Labour government in the UK could mean you may have to eventually replace that ccTLD (Country Code Top Level Domain).
As reported by the BBC, the UK is “giving up sovereignty of a remote but strategically important cluster of islands in the Indian Ocean.” Under the terms of the deal, it will “hand over the Chagos Islands to Mauritius in a historic move.”
While the move certainly has political implications in that a US-UK military base located on Diego Garcia, the largest island in the region, will remain in operation, it may also result in the elimination of the .io domain for one simple reason — the region it represents will no longer exist.
The domain name regulatory environment works as follows: the ISO 3166 standard is used to define a nation or region’s ccTLD and the Internet Corporation for Assigned Names and Numbers (ICANN) maintains that standard. Also involved is the Internet Assigned Numbers Authority or IANA, a standards organization that oversees global IP addresses and is an operating unit of ICANN.
In the case of the .io domain, digital strategist Gareth Edwards wrote in a social media post, “IANA bases TLDs off ISO 3166 country codes. If a code stops existing, in theory, they follow suit and kill the TLD. Officially this was British Indian Ocean Territory. That is the .io domain everyone loves so much.”
According to Edwards, “once this treaty is signed, the British Indian Ocean Territory will cease to exist. Various international bodies will update their records. In particular, the International Standard for Organization (ISO) will remove country code ‘IO’ from its specification.”
While an email from Computerworld to the ISO 3166 Maintenance Agency asking for comment is so far unanswered, Kim Davies, vice president of IANA Services and president of Public Technical Identifiers (PTI) at ICANN, said ICANN relies on “the ISO 3166-1 standard to make determinations on what is an eligible country-code top-level domain.”
Currently, he said, “the standard lists the British Indian Ocean Territory as IO. Assuming the standard changes to reflect this recent development, there are multiple potential outcomes depending on the nature of the change.”
According to Davies, one such change “may involve ensuring there is an operational nexus with Mauritius to meet certain policy requirements. Should .io no longer be retained as a coding for this territory, it would trigger a five-year retirement process, during which time registrants may need to migrate to a successor code or an alternate location.”
He added, “We cannot comment on what the ISO 3166 Maintenance Agency may or may not do in response to this development. It is worth noting that the ISO 3166-1 standard is not just used for domain names, but many other applications. The need to modify or retain the IO encoding may be informed by needs associated with those other purposes, such as for Customs, passports, and banking applications.”
Edwards’ advice to any organization that might be impacted is this: “There’s no need for anyone with an .io domain to panic. The IANA may decide to fudge their own rules and keep the domain going, perhaps assigned to Mauritius instead, or by turning it into a generic, non-country domain. Even if they decide to deprecate it, this will be managed over multiple years.”
However, he added, “If an organization has made .io part of their identity, though, then it may be time to at least think about a brand review.”
Source:: Computer World
A file extension bug in Microsoft 365 can delete Word documents

A bug in version 2409 of Microsoft 365 can cause Word documents to be deleted instead of saved, Microsoft has warned. The bug affects files that contain the # character or have file extensions in uppercase, such as .DOCX or .RTF.
Until the company releases a permanent fix, users are being urged to check whether missing files they thought had been saved instead wound up in the Recycle Bin.
An alternative solution is to roll back Microsoft 365 to an older version, according to Bleeping Computer.
Source:: Computer World
European Investment Bank crafts new funding plan to keep startups in the EU
vivo V40e Review: Sleek Design & Great Cameras
Nebius is tripling Nvidia GPU capacity at its AI data centre in Finland
The Tesla Supercharger network is expanding again
By Nick Godt

The Tesla Supercharger network grew again in the third quarter, after massive layoffs at Tesla had led to a slide in new stalls earlier this year.
Source:: Digital Trends
EU ruling clamps down on Meta’s use of personal data for ads

The European Court of Justice has decided that Facebook owner Meta must minimize the amount of personal data it uses for personalized ads, the BBC reports . The decision from the EU’s top court means that only a small part of Meta’s data collection can be used for advertisements.
The ruling stems from a complaint by privacy activist Max Schrems, who said Facebook used data about his sexual orientation for targeted ads — even though Schrems himself had not shared information about his sexual orientation on the platform.
Meta said it does not use so-called specially categorized data linked to sexual orientation, race, ethnicity, state of healt,h or religion for personalized ads. Such data is classified as sensitive and EU data protection legislation has strict requirements for processing it. The company says it takes privacy very seriously and would have further comment after it reviews the ruling.
Source:: Computer World
Think data leaks are bad now? Wait until genAI supersizes them

The concept of data leakage — and all of its privacy, legal, compliance and cybersecurity implications — today has to be fundamentally re-envisioned, thanks to the biggest IT disruptor in decades: generativeAI (genAI).
Data leakage used to be straight-forward. Either an employee/contractor was sloppy (leaving a laptop in an unlocked car, forgetting highly-sensitive printouts on an airplane seat, accidentally sending internal financial projections to the wrong email recipient) or because an attacker stole data either while it was at rest or in transit.
Those worries now seem delightfully quaint. Enterprise environments are entirely amorphous, with data leakage just as easily coming from a corporate cloud site, a SaaS partner, or from everyone’s new-favorite bugaboo: a partner’s large language model (LLM) environment.
Your enterprise is responsible for every bit of data your team collects from customers and prospects. What happens when new applications use your old data in new ways? And what then happens when that customer objects? What about when a regulator or a lawyer in a deposition objects?
When the walls are this amorphous, how precisely is IT supposed to be in control?
Consider this scary tidbit. A group of Harvard University students started playing with digital glasses to leverage real-time data access. The most obvious takeaway from their experiment is it that it can be a highly effective tool for thieves (conmen, really). It allows someone to walk up to a stranger and instantly know quite a bit about them. What a perfect way to kidnap someone or steal their money.
Imagine a thief using this tool to talk his/her way into a highly-sensitive part of your office? Think about how persuasive it could make a phishing attack.
As bad as that all is, it’s not the worst IT nightmare — that nightmare is when the victim later figures out the misused data came from your enterprise database, courtesy of a detour through a partner’s LLM.
Let’s step away from the glasses nightmare. What happens when an insurance company uses your data to deny a loan or your HR department uses the data to deny someone a job? Let’s further assume that it was the AI partner’s software that made a mistake. Hallucinations anyone? And that mistake led to a destructive decision. What happens then?
The underlying data came from your confidential database. Your team shared it with genAI partner 1234. Your team hired 1234 and willingly gave them the data. Their software screwed it up. How much of this is your IT department’s fault?
There is a terrible tendency of litigation to split fault into percentages and to give a healthier percentage to the entity with the deepest pocket. (Hello, enterprise IT — your company quite likely has the deepest pocket.)
There are several ways to deal with these scenarios, but not all of them will be particularly popular.
1. Contractual — put it in writing. Have strict legal terms that put your AI partner on the hook for anything it does with your data or any fallout. This won’t prevent people from seeing the inside of a courtroom, but at least they’ll have company.
2. Don’t share data. This is probably the least popular option. Set strict limits on which business units can play with your LLM partners, and review and approve the level of data they are permitted to share.
When the line-of-business chief complains — virtually guaranteed to happen — tell that boss that this all about protecting that groups’ intellectual property and, in turn, that LOB chief’s bonus. Mention that this preserves their bonus and watch the objections melt away.
3. Impose stiff punishments for Shadow AI violations. In theory, you can control contacts and data access with your key genAI partners. But if your people start feeding data into ChatGPT, Perplexity or their own account on CoPilot, they need to know that they will be discovered and that two violations mean termination.
First, you need to take this request up as high as you can to get in writing that it will happen. Because, trust me, if you say that a second violation will result in termination, and then some top-tier salesperson violates and does not get fired, wave bye-bye to your credibility. And with that, any chance people will take your rules seriously. Don’t threaten to fire someone until you are certain you can.
Maybe something equally effective would be canceling their next two bonus/commission payments. Either way, find something that will get the attention of the workforce.
4. The anti-contract. Lawyers love to generate 200-page terms of service that no one reads. I just need to remind you that such terms will be ignored by courtroom juries. Don’t think you can really right-click your legal exposure away.
This is triply the case when your customers are outside the United States. Canada, Europe, Australia and Japan, among others, focus on meaningful and knowing consent. Sometimes, you are banned from forcing acceptance of the terms if you choose to use the product/service.
5. Compliance. Do you even have legal permission to share all of that data with an LLM partner? Outside the US, most regulators are told that customers own their data, not the enterprise. Data being mis-used — as in the Harvard glasses example — is one thing. But if your genAI partner makes a mistake or hallucinates and sends flawed data out into the world, you can be exposed to pain well beyond simply sharing too much info.
You can never have too many human-in-the-loop processes in place to watch for data glitches. Yes, it will absolutely dilute genAI efficiency gains. Trust me: for the next couple of years, it will deliver a better ROI than genAI will on its own.
Source:: Computer World
Stockholm startup Lovable raises $7.5M for AI coding assistant
What European founders need to know about US vs EU market expansion
Toyota bets big on air taxis with $500M investment in Joby
By Nick Godt

Auto giant Toyota is investing another $500 million into Joby, which pioneered the first test flight of an air taxi over the skies of New York City.
Source:: Digital Trends
Google’s ad-tech antitrust trial: Wrapping up the case for the defense

And now we wait.
Last week, Google did its best to refute the US Department of Justice’s case that the company has built a series of monopolies in the markets for ad serving, ad exchanges, and ad networks, and the DOJ made its rebuttal. Closing arguments will be heard Nov. 25, after both parties have presented their amended findings of fact.
Judge Leonie Brinkema moved the hearing along briskly: The first phase, which had been expected to take up to two months, wrapped in just three weeks. The first two weeks were mostly devoted to the DOJ’s presentation of its case that Google engaged in a “systematic campaign to seize control” of the “tools used by publishers, advertisers, and brokers to facilitate digital advertising.”
As the trial headed towards its third week, Google called its first witness, Scott Sheffer, the company’s vice president of publisher partnerships,.
As Google Vice President of Regulatory Affairs Lee-Anne Mulholland recounted in a blog post, Sheffer explained that Google offers publishers tools that the DOJ completely ignored in making its case — such as AdSense, used by more publishers than the Ad Manager product at issue in the trial.
But a reporter for the CheckMyAds campaign group attending the trial described how, on cross-examination, DOJ lawyers stripped back the tangled web of advertising products Google presented, removing those that do not allow publishers to monetize display ad inventory on their websites, leaving only “the products that form the basis of the markets in the DOJ’s complaint.”
Last look
Later in the week, Google called economist Paul Milgrom, winner of the 2020 Nobel Prize in Economics for his work on auction theory. According to Mulholland, he testified “every one of the conducts we’ve described — Google’s programs — benefited its own customers, either advertisers or publishers or both,” and said that “Google’s changes to its own auction were improvements at the time in which they occurred relative to what had come before.”
Under the DOJ’s cross-examination, according to the CheckMyAds’ reporter, Milgrom conceded that Google does have an advantage over competitors because of practices such as “Last Look” (in which Google gets a chance to outbid the highest bidder in an ad auction) and Sell-Side Dynamic Revenue Share (in which Google sits on the buy and sell sides of transactions, potentially allowing it to manipulate its margin to win auctions). Milgrom acknowledged he had not analyzed the impact of Last Look on other exchanges or on competition in his research.
Per Bjorke, product management director of Google’s Ad Traffic Quality team, was called to testify about how Google keeps bad actors out of its ad exchanges (so publishers don’t end up paying them for fake traffic, for example).
Judith Chevalier, a professor of finance and economics at Yale University, told the court that using Google tools takes a lower share of publishers’ revenue, and that on average it is “less expensive to use Google-to-Google than using third-party-to-third-party” tools for connecting publishers and advertisers, Mulholland wrote.
Only connect
CheckMyAds noted that a chart presented by Chevalier showed that Google Ads was the only buying tool that connected with Google Ad Exchange, a fact DOJ noted in its cross-examination. The integration of Google’s different ad technologies and the lack of openness to competitors is one elements of the DOJ’s case.
Mulholland didn’t namecheck any of the witnesses Google called in its last two days of evidence, but CheckMyAds had plenty to say about Mark Israel, an economics expert who, it came out in questioning, has done paid work for Google in the past. He sought to show that the market for online advertising is a single two-sided market and not the three separate markets (ad servers, ad networks, and ad exchanges) the DOJ says it is.
After Google wrapped up its case, this phase of the hearing concluded with the DOJ calling one last witness in a bid to rebut some of Google’s claims. It asked Matthew Wheatland, chief digital officer of British newspaper The Daily Mail, about some of the alternatives to Google that Israel had suggested publishers might use; according to CheckMyAds’ account of the session, Israel’s and Wheatland’s views did not align.
Brinkema sent Google and the DOJ away with about a month to present their amended findings of fact. After closing arguments, she may issue her opinion before the end of the year.
That’s not going to be the end of it, though. If things go the DOJ’s way, a separate hearing will be held to determine appropriate remedies. And with its business model at stake, Google will almost certainly appeal any ruling, or part of the ruling, that goes against it.
Source:: Computer World
Ukraine’s new F-16 simulator spotlights a ‘paradigm shift’ led from Europe
Best Samsung deals: The Galaxy S24 Ultra is up to $750 off
ESA’s ‘planetary defence mission’ has startups dreaming of asteroid mining
How to Cross Out Text in Google Docs?